Useful tricks to view and search logs
It often happens that we have to catch a given message, e.g. “error” while browsing the logs. Alternatively, we look for the occurrence of a given phrase in the old files. Both “tail” and “grep” are very useful for this. Especially if the logs are set in verbal mode, where there is a lot of messages in the log. We can also exclude certain phrases after parsing the information set. It is enough to use grep properly.
Let’s start by looking at all nginx logs.
In this case, sorting from oldest to newest is very useful as we know where to find the newest log entries:
|
1 2 |
# cd /var/log/nginx/ # ls -ltr * |
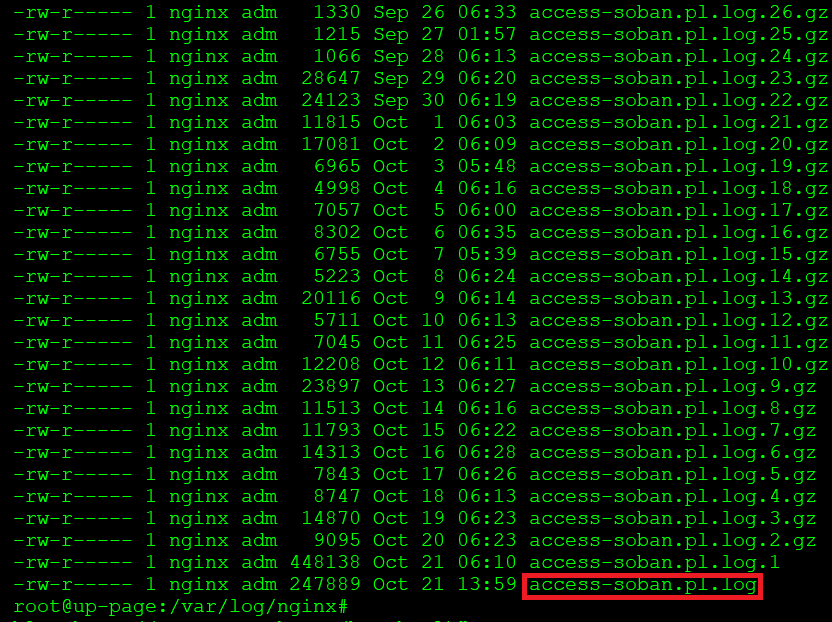
If we are interested in the latest data, we will focus on the access-soban.pl.log file.
I know that my website is monitored by uptimerobot.com and I would like to find out, for example, from what IP address the website gets a query, e.g. to add it to the firewall as trusted:
|
1 |
# grep -i uptime access-soban.pl.log |
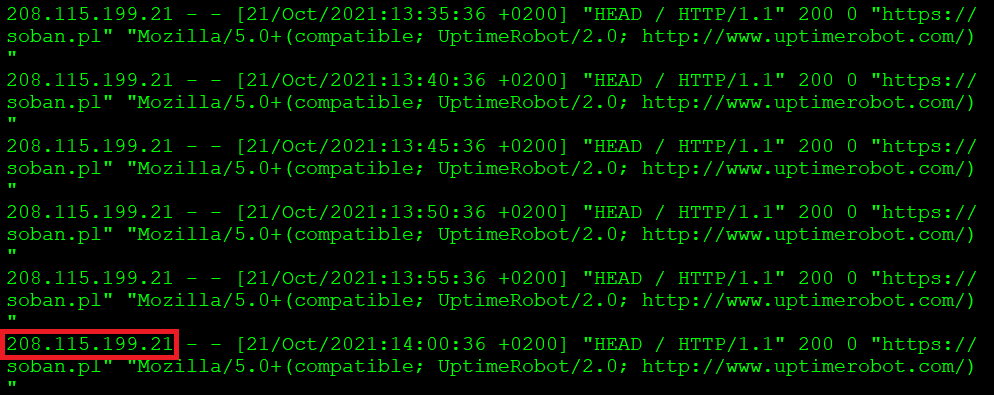
As you can see, in this case, the bot that is querying the server has the IP address: 208.115.191.21. If I wanted to see all calls from this IP address, I could view them this way:
|
1 |
# grep 208.115.199.21 access-soban.pl.log* | less |
If I press (shift + g) I’ll go to the bottom of the log:
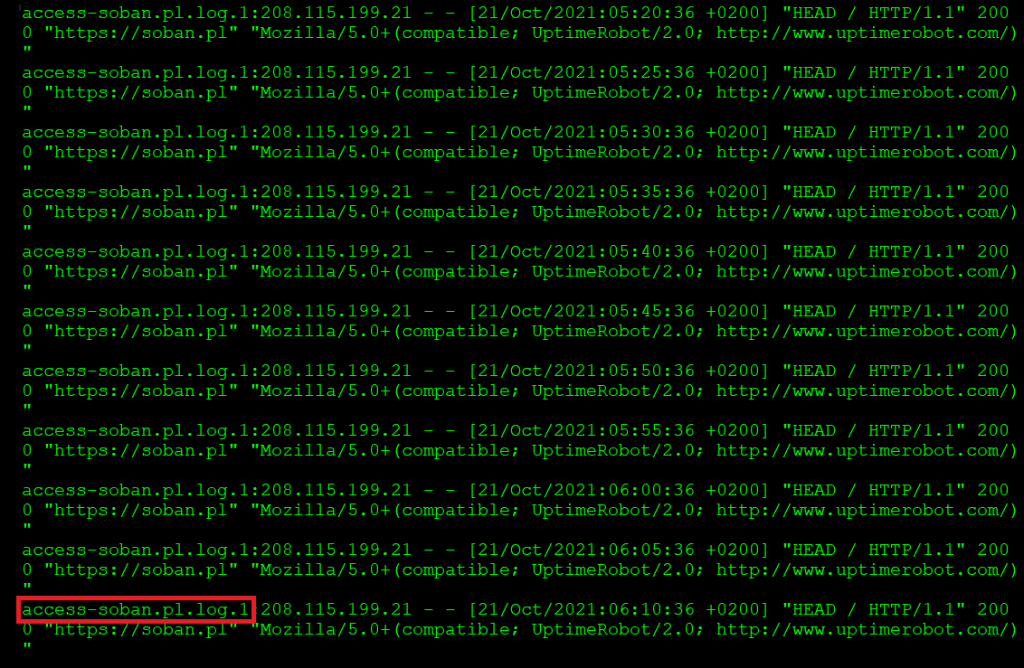
It is worth noting that in this case the file in which the query is located is also given.
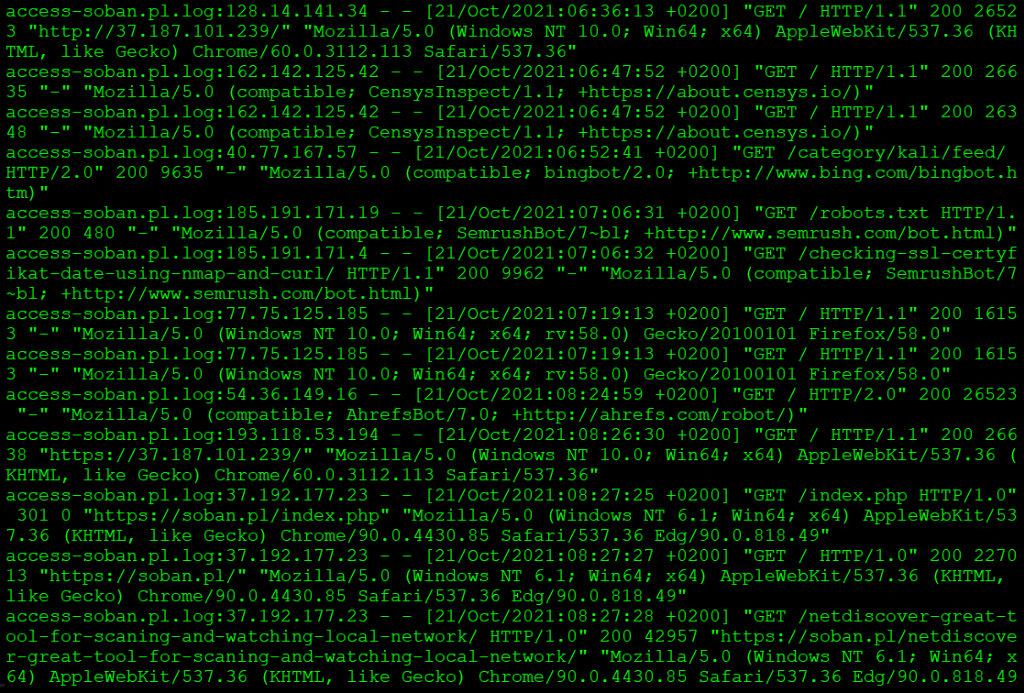
Now suppose I would like the logs, but without the “uptimerobot“:
|
1 |
# grep -v uptimerobot access-soban.pl.log* | less |
This way all queries containing the word “uptimerobots” were cut. We can of course diminish the output from the console more by adding “| grep -v” possibly. Let’s cut out “sitemap“:
|
1 |
# grep -v uptimerobot access-soban.pl.log* | grep -v sitemap | less |
One handy thing is to direct the stream from the console output to a file. We do this as follows “/tmp/file.log“:
|
1 |
# grep -v uptimerobot access-soban.pl.log | grep -v sitemap >> /tmp/file.log |
Additionally, we can pack the file:
|
1 |
# tar -zcf /tmp/file.log.tar.gz /tmp/file.log |
After packing the file, we can send it to another person. Sensitive data, such as inquiries or logins, can be cut using grep, as we did above.
Now let’s move on to one of the most useful tools for watching live what happens when someone enters a page:
|
1 |
# tail -f *.log |
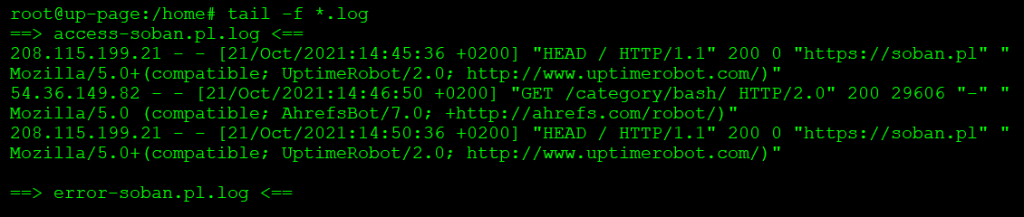
At this point it is worth noting that we “caught” the logs from the files: “access-soban.pl.log” and “error-soban.pl.log”. However, the “error-soban.pl.log” log is empty, so its content is not shown below. However, if something came up, we would see the contents of the updated file on the console.
Useful at this point is to combine grep and tail. We’re assuming we don’t want uptimerobots to bump into our consoles while observing the logs, so we’re going to cut them like this:
|
1 |
# tail -f *.log | grep -v uptimerobots |
The given examples can be modified in any way. I encourage you to use it in various combinations of tail and grep, especially in situations where erros/warning are repeated. Of course, not only in nginx logs you can use these commands. In all logs where we operate on text, be it system or application. Passing the text mentioned above is very helpful.